Login required to access the wiki. Please register to create your login credentials We apologize for any inconvenience this may cause, but please note that this step is necessary to protect your privacy and ensure a safer browsing experience. Thank you for your cooperation. Documents available for download: GAMSO , GSBPM , GSIM |
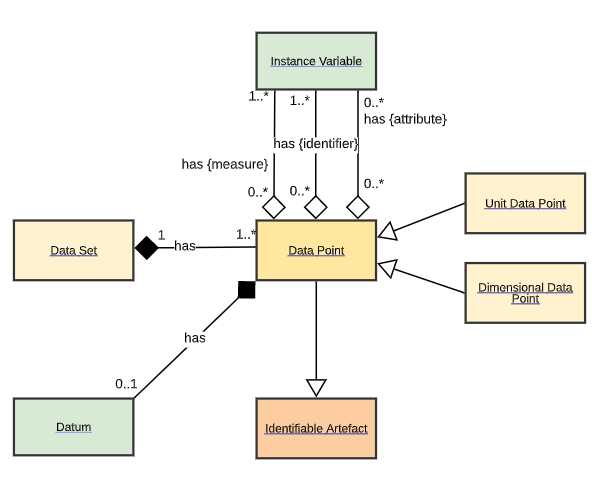
A colleague and I had a discussion today around Data Point and how it relates to Instance Variable.
Let me exemplify our discussion…
..Assume we have a Data structure defined as follows:
Identifier: Gender = {M, F}
Identifier: Age = { -20, 20+}
Measure: Amount of individuals = Positive number
Measure: Grade = Number between 1 to 5
This could give us a Dataset that might look like this in a spreadsheet

Would then the blue cells be considered as Data Points? That is all combinations of Identifier components and Measure components. (Or are both the blue and the white cells Data Point?)
If so then de definition av the Data Point is a bit confusing for me. It is: “A placeholder (or cell) for the value of an Instance Variable.” The confusing part is that interpret it to be the cell for Gender and Age since they are the placeholders for the value of the Instance Variable.
But what me and my colleague actually where discussing was the carnality between the Data Point and the Measure components that states it could be one or many (1..*). But should it be just one (1..1 )? The reason for this is that the Measure components also defines the “point in space” for the Data Point. If it does not then would there be a Datum for each Measure component associated to the Data Point
I would appreciate if someone could help me with my questions
Kind regards
Petros
5 Comments
InKyung Choi
16 Oct, 2019Hi Petros, I don't know the answer but I will still add my comments here in case others (beginners like me) reading this post later have a similar way of thinking (and also understanding non-answers help understanding answers )
)
One question about your example, aren't "Gender {M, F}" and "Age {-20,20+}" Measure Components? Or is combination of these two Measure Components are being used as an Identifier Component?
Anyway, whether they are Measure Components or Identifier Components, sheet area A2:D5 contains values of Instance Variables, so it seems for me both white and blue cells are Data Points.
And regarding the cardinality, Measure Component is role given to Represented Variable, and at least for Unit Data Point, explanatory text says "This placeholder may point to multiple values representing different versions of the data", then for Instance Variable, there can be many (1..*)....? Not sure how a placeholder can have (?) multiple values....
Jenny Linnerud Dan Gillman could you help us understand this?
Dan Gillman
16 Oct, 2019Hi,
I think there is a lot of confusion between the roles an Instance Variable can play for a particular Data Point and what the Data Point contains. Jenny Linnerud can correct me if I have this wrong, but this is my understanding. Lets consider 6 Instance Variables and their Value Domains (listed underneath):
IV1 - unitID
3 digit positive integer
IV2: gender
<m, male>
<f, female>
IV3: marital status
<m, married>
<s, single>
IV4: weekly wage
non-negative currency value (in Euros)
IV5: average weekly wage
non-negative currency value (in Euros)
IV6: GxMS cross product
combinations of gender and marital status
Consider the following microdata file for 2 units
ID Gender Marital Status Weekly wage
001 m m Euro 1500.00
002 f s Euro 925.00
In this table, every cell is a Data Point, and the symbol written represents a Datum. For the Weekly Wage column, each Data Point has the following roles for some IVs:
IV1 - identifer
IV2 - attribute
IV3 - attribute
IV4 - measure
It is the measure role that supplies the Datum, the other IVs are descriptive in some way. The values are metadata for the cell.
For the Gender column, we use the following roles
IV1 - identifier
IV2 - measure
The other Instance Variables don't have a role.
The Marital Status column is similar.
For the UnitID column, the case is more interesting:
IV1 - identifier
IV1 - measure
Here, the unitID Instance Variable takes on 2 roles. We could also give attribute roles to the Gender and Marital Status IVs. That depends on what the application might need. There are no absolutes about these roles, except the measure role supplies the Datum as I understand it. There can be more than one measure contributing to the Datum in each cell.
For a Cube, the cells have the following roles attached:
IV6: identifier
IV5: measure
Note, we had to create a new variable to account for the categories in the Cube cells, because IV2 and IV3 only assign their categories to individual units, not the aggregates.
With more data, we might also identify one or more IVs with the attribute role for each cell. Each cell is identified by an element of the cross-product of the Gender and Marital Status value domains, producing 4 cells in this case
male, single
male, married
female, single
female, married
The Datum in each cell is the Average Weekly Wage, IV5. Here, the unitID IV does not take on a role, as it is not included in the aggregations.
A table representing the Cube might look like this:
Average Weekly Wage (in Euros)
Male
Single 1002.78
Married 1498.03
Female
Single 951.22
Married 1349.74
Note - these data are purely fictitious. (This proves data are not necessarily facts.)
Let me know if this is wrong or not clear.
Yours,
Dan
Petros Likidis
17 Oct, 2019Hi,
Thank you very much Dan Gillman and InKyung Choi for clarifying it for me.
I see that I mixed up the type of a DataStructure component and the role of the Instance Variable.
I have to admit that my example was not that well formulated. My intention was that I have a group of 23 individuals and that I made a cube by aggregating different data of these individuals by gender and age. Gender and age would uniquely identify each aggregate. In Dan Gillman cube example he had an IV with the cross product. Would I have to create a similar IV or is there a way to express it as in my example?
Kind regards
Petros
Jenny Linnerud
17 Oct, 2019Following Dan’s example, Dan Gillman can correct me if I have misunderstood,
IV2: gender
<m, male>
<f, female>
IV7: age category
<-20, less than 20 years>
<20+, 20 or more years>
IV8: average grade
Number between 1 and 5
IV9: gender x age cross product
Combinations of gender and age category
For a Cube, the cells have the following roles attached
IV9: identifier
IV8: measure
A table representing the Cube might look like this:
Male Average grade
-20 3.1
20+ 3.2
Female
-20 3.3
20+ 3.0
Now back to the Data Point
Each cell in the Cube is a Data Point: (male, -20), (male, 20+), (female, -20), (female, 20+)
with Average grad as the datum in Data Point i.e. 3.1, 3.2, 3.3, 3.4 respectively
Dan Gillman
17 Oct, 2019Yes, and rather than defining IV9, you could create 2 variables, one that maps age categories to cells and the other that maps gender categories. You have less control this way, though. The cross product idea is more sound and provides each combination correctly.
In reality, the idea of using the roles for cube data points doesn't really make sense except for the measure role. The cells in a cube are DEFINED and take their semantics from the elements of the cross product of all the dimensions that define the cube. The elements of each dimension are the categories from the value domains in the classification variables in the microdata. Looking at the definitions of the cells from the point of view of the dimensions rather than variables is cleaner. You don't have to go through gyrations to define the special purpose variables. Plus, dimensions can be reused as needed, and they already had to be created as enumerated value domains in the microdata.
The notion that the category combination identifies each cell is incomplete. The categories provide the semantics for each cell, and arguably this is the more important feature.
This is how we view the situation at BLS. We've built a model for cubes and time series that depends completely on dimensions. The only variables we care about are the measures. In addition, this model was incorporated into DDI and will be released as part of the DDI-4 Core product in January. The model has also been adopted by the OMG FIBO (Financial Industry Business Ontology) project.
I can share this model but it is in Visio, and I can't export it except for taking screen shots or cutting and pasting the diagrams into, say, a Word file.