Login required to access the wiki. Please register to create your login credentials We apologize for any inconvenience this may cause, but please note that this step is necessary to protect your privacy and ensure a safer browsing experience. Thank you for your cooperation. Documents available for download: GAMSO , GSBPM , GSIM |
33. This section considers each phase in turn, identifying the various sub-processes within that phase and describing their contents.
Specify Needs Phase

34. This phase is triggered when a need for new statistics is identified or feedback about current statistics initiates a review. It includes all activities associated with engaging stakeholders to identify their detailed statistical needs (current or future), proposing high level solution options and preparing a business case to meet these needs.
35. The "Specify Needs" phase is broken down into six sub-processes (Figure 4), which are generally sequential, from left to right, but can also occur in parallel, and can be iterative. These sub-processes are:
1.1. Identify needs
36. This sub-process includes the initial investigation and identification of what statistics are needed and what is needed of the statistics. It may be triggered by a new information request or an environmental change such as a reduced budget. Action plans from evaluations of previous iterations of the process or from other processes might provide an input to this sub-process. It also includes consideration of practice amongst other (national and international) statistical organisations producing similar data and the methods used by those organisations.
1.2. Consult and confirm needs
37. This sub-process focuses on consulting with the internal and external stakeholders and confirming in detail the needs for the statistics. A good understanding of user needs is required so that the statistical organisation knows not only what it is expected to deliver, but also when, how, and, perhaps most importantly, why. For the second and subsequent iterations of this phase, the main focus will be on determining whether previously identified needs have changed. This detailed understanding of user needs is the critical part of this sub-process.
1.3. Establish output objectives
38. This sub-process identifies the statistical output objectives that are required to meet the user needs identified in sub-process 1.2 (Consult and confirm needs). It includes agreeing the suitability of the proposed outputs and their quality measures with users. Legal frameworks (e.g. relating to confidentiality), and available resources are likely to be constraints when establishing output objectives.
1.4. Identify concepts
39. This sub-process clarifies the required concepts to be measured from the point of view of the users. At this stage, the concepts identified might not align with existing statistical standards. This alignment, and the choice or definition of the statistical and other concepts and variables to be used, takes place in sub-process 2.2 (Design variable descriptions).
1.5. Check data availability
40. This sub-process checks whether current sources of data could meet user requirements and the conditions under which they would be available including any restrictions on their use. An assessment of possible alternatives would normally include research into potential administrative or other non-statistical sources of data, to:
- Determine whether they would be suitable for use for statistical purposes (e.g. the extent to which administrative concepts match data requirements, timeliness and quality of the data, security and continuity of data supply);
- Assess the division of responsibilities between data providers and the statistical organisation;
- Check necessary ICT resources (e.g. data storage, technology required to handle incoming data and data processing) as well as any formal agreements with data providers for accessing and sharing the data (e.g. formats, delivery, accompanying metadata and quality check).
41. When existing sources have been assessed, a strategy for filling any remaining gaps in the data requirement is prepared. This may include identifying possible partnerships with data holders. This sub-process also includes a more general assessment of the legal framework in which data would be collected and used, and may therefore identify proposals for changes to existing legislation or the introduction of a new legal framework.
1.6. Prepare and submit business case
42. This sub-process documents the findings of the other sub-processes in this phase in the form of a business case to get approval to implement the new or modified statistical business process. Such a business case would need to conform to the requirements of the approval body, but would typically include elements such as:
- A description of the "As-Is" business process (if it already exists), with information on how the current statistics are produced, highlighting any inefficiencies and issues to be addressed;
- The proposed "To-Be" solution, detailing how the statistical business process will be developed to produce the new or revised statistics;
- An assessment of costs and benefits, as well as any external constraints.
43. The business case describes options and makes recommendations. It may include the benefits, costs, deliverables, time frame, budget, required technical and human resources, risk assessment and impact on stakeholders for each option.
44. After the business case is prepared, it is submitted for approval to move to the next phase of the business process. At this sub-process, a “go”/“no go” decision is made. Typically, the business case is reviewed and formally approved or disapproved by the appropriate sponsors and governance committees.
Design Phase

45. This phase describes the development and design activities, and any associated practical research work needed to define the statistical outputs, concepts, methodologies, collection instruments and operational processes. It includes all the design elements needed to define or refine the statistical products or services identified in the business case. This phase specifies all relevant metadata, ready for use later in the business process, as well as quality assurance procedures. For statistical outputs produced on a regular basis, this phase usually occurs for the first iteration and whenever improvement actions are identified in the “Evaluate” phase of a previous iteration.
46. Design activities make substantial use of international and national standards in order to reduce the length and cost of the design process, and enhance the comparability and usability of outputs. Organisations are encouraged to reuse or adapt design elements from existing processes, and to consider geospatial aspects of data in the design to enhance the usability and value of the statistical information. Additionally, outputs of design processes may form the basis for future standards at the organisational, national or international levels.
47. The “Design” phase is broken down into six sub-processes (Figure 5), which are generally sequential, from left to right, but can also occur in parallel, and can be iterative. These sub-processes are:
2.1. Design outputs
48. This sub-process contains the detailed design of the statistical outputs, products and services to be produced, including the related development work and preparation of the systems and tools used in the "Disseminate" phase. Processes governing access to any confidential outputs are also designed here. Outputs should be designed to follow existing standards wherever possible, so inputs to this process may include metadata from similar or previous collections (including extractions from statistical, administrative, geospatial and other non-statistical registers and databases), international standards, and information about practices in other statistical organisations from sub-process 1.1 (Identify needs). Outputs may also be designed in partnership with other interested bodies, particularly if they are considered to be joint outputs, or they will be disseminated by another organisation.
2.2. Design variable descriptions
49. This sub-process defines the variables to be collected via the collection instrument, as well as any other variables that will be derived from them in sub-process 5.5 (Derive new variables and units), and any statistical or geospatial classifications that will be used. It is expected that existing national and international standards will be followed wherever possible. This sub-process may need to run in parallel with sub-process 2.3 (Design collection), as the definition of the variables to be collected, and the choice of collection instruments may be inter-dependent to some degree. Preparation of metadata descriptions of collected and derived variables, statistical and geospatial classification is a necessary precondition for subsequent phases.
2.3. Design collection
50. This sub-process determines the most appropriate collection instruments and methods which may depend on the type of data collection (census, sample survey, or other), the collection unit type (enterprise, person, or other) and the available sources of data. The actual activities in this sub-process will vary according to the type of collection instrument required, which can include computer assisted interviewing, paper questionnaires, administrative registers (e.g. by using existing service interfaces), data transfer methods, web-scraping technologies as well as technology for geospatial data. Direct or indirect use of administrative data may be introduced in the data collection mode for either controlling survey data or assisting it when capturing survey information.
51. This sub-process includes the design of the collection instruments, questions and response templates (in conjunction with the variables and statistical classifications designed in sub-process 2.2 (Design variable descriptions)). It also includes the confirmation of any formal agreements. This sub-process is enabled by tools such as question libraries (to facilitate the reuse of questions and related attributes), questionnaire tools (to enable the quick and easy compilation of questions into formats suitable for cognitive testing) and agreement templates (to help standardise terms and conditions). This sub-process also includes the design of provider management systems that are specific to this business process.
52. Where statistical organisations do not collect data directly (i.e. a third party controls the collection and processing of the data), this sub-process may include the design of mechanisms to monitor the data and the metadata to assess impacts of any change made by the third party.
2.4. Design frame and sample
53. This sub-process only applies to processes which involve data collection based on sampling, such as through statistical surveys. It identifies and specifies the population of interest, defines a sampling frame (and, where necessary, the register from which it is derived), and determines the most appropriate sampling criteria and methodology (which could include complete enumeration). Common sources for a sampling frame are administrative and statistical registers, censuses and information from other sample surveys. It may include geospatial data and classifications. This sub-process describes how these sources can be combined if needed. Analysis of whether the frame covers the target population should be performed. A sampling plan should be made. The actual sample is created in sub-process 4.1 (Create frame and select sample), using the methodology specified in this sub-process.
2.5. Design processing and analysis
54. This sub-process designs the statistical processing methodology to be applied during the "Process" and "Analyse" phases. This can include among others, specification of routines and rules for coding, editing and imputation which may vary based on the mode of data collection and source of data. This sub-process also includes design of specifications for data integration from multiple data sources, validation of data and estimation. Statistical disclosure control methods are also designed here if they are specific to this business process.
2.6. Design production systems and workflow
55. This sub-process determines the workflow from data collection to dissemination, taking an overview of all the processes required within the whole production process and ensuring that they fit together efficiently with no gaps or redundancies. Various systems and databases are needed throughout the process. The GSBPM can be used as the basis of the business architecture layer when a statistical organisation has an existing enterprise architecture in place. The design might be adjusted to fit the organization. A general principle is to reuse processes and technology across many statistical business processes, so existing production solutions (e.g. services, systems and databases) should be examined first, to determine whether they are fit for purpose for this specific production process, then, if any gaps are identified, new solutions should be designed. This sub-process also considers how staff will interact with systems and who will be responsible for what and when.
Build Phase

56. This phase builds and tests the production solution to the point where it is ready for use in the "live" environment. The outputs of the "Design" phase are assembled and configured in this phase to create the complete operational environment to run the process. New services are built by exception, created in response to gaps in the existing catalogue of services sourced from within the organisation and externally. These new services are constructed to be broadly reusable in alignment with the business architecture of the organisation where possible.
57. For statistical outputs produced on a regular basis, this phase usually occurs for the first iteration, following a review or a change in methodology or technology, rather than for every iteration.
58. The “Build” phase is broken down into seven sub-processes (Figure 6), which are generally sequential, from left to right, but can also occur in parallel, and can be iterative. The first three sub-processes are concerned with the development and improvement of systems used in collection, processing, analysis and dissemination of data. The last four sub-processes focus on the end-to-end process. These sub-processes are:
3.1. Reuse or build collection instruments
59. This sub-process describes the activities to build and reuse the collection instruments to be used during the "Collect" phase. The collection instruments are built based on the design specifications created during the "Design" phase. A collection may use one or more modes to receive the data (e.g. personal or telephone interviews; paper, electronic or web questionnaires; SDMX web services). Collection instruments may also be data extraction routines used to gather data from existing statistical or administrative registers (e.g. by using existing service interfaces). This sub-process also includes preparing and testing the contents and functioning of that collection instrument (e.g. cognitive testing of the questions in a questionnaire). It is recommended to consider the direct connection of collection instruments to a metadata system, so that metadata can be more easily captured in the collection phase. Connecting metadata and data at the point of capture can save work in later phases. Capturing the metrics of data collection (paradata) is also an important consideration in this sub-process for calculating and analysing process quality indicators.
3.2. Reuse or build analysis components
60. This sub-process describes the activities to reuse existing components or build new components needed for the “Process” and “Analyse” phases, as designed in the "Design" phase. Services may include dashboard functions and features, information services, transformation functions, geospatial data services, workflow frameworks, provider and metadata management services.
3.3. Reuse or build dissemination components
61. This sub-process describes the activities to build new components or reuse existing components needed for the dissemination of statistical products as designed in sub-process 2.1 (Design outputs). All types of dissemination components are included, from those that produce traditional paper publications to those that provide web services, (linked) open data outputs, geospatial statistics, maps, or access to microdata.
3.4. Configure workflows
62. This sub-process configures the workflow, systems and transformations used within the business processes, from data collection through to dissemination. In this sub-process, the workflow is configured based on the design created in sub-process 2.6 (Design production systems and workflows). This could include modifying a standardised workflow for a specific purpose, assembling the workflows for the different phases together (possibly with a workflow/business process management system) and configuring systems accordingly.
3.5. Test production systems
63. This sub-process is concerned with the testing of assembled and configured services and related workflows. It includes technical testing and sign-off of new programmes and routines, as well as confirmation that existing routines from other statistical business processes are suitable for use in this case. Whilst part of this activity concerning the testing of individual components and services could logically be linked with sub-process 3.1, 3.2 and 3.3, this sub-process also includes testing of interactions between assembled and configured services, and ensuring that the whole production solution works in a coherent way.
3.6. Test statistical business process
64. This sub-process describes the activities to manage a field test or pilot of the statistical business process. Typically, it includes a small-scale data collection, to test the collection instruments, followed by processing and analysis of the collected data, to ensure the statistical business process performs as expected. Following the pilot, it may be necessary to go back to a previous step and make adjustments to collection instruments, systems or components. For a major statistical business process, e.g. a population census, there may be several iterations until the process is working satisfactorily.
3.7. Finalise production systems
65. This sub-process includes the activities to put the assembled and configured processes and services, including modified and newly-created services, into production ready for use. The activities include:
- Producing documentation about the process components, including technical documentation and user manuals;
- Training the users on how to operate the process;
- Moving the process components into the production environment and ensuring they work as expected in that environment (this activity may also be part of sub-process 3.5 (Test production system)).
Collect Phase

66. This phase collects or gathers all necessary information (e.g. data, metadata and paradata), using different collection modes (e.g. acquisition, collection, extraction, transfer), and loads them into the appropriate environment for further processing. Whilst it can include validation of data set formats, it does not include any transformations of the data themselves, as these are all done in the "Process" phase. For statistical outputs produced regularly, this phase occurs in each iteration.
67. The "Collect" phase is broken down into four sub-processes (Figure 7), which are generally sequential, from left to right, but can also occur in parallel, and can be iterative. These sub-processes are:
4.1. Create frame and select sample
68. This sub-process establishes the frame and selects the sample for this iteration of the collection, as specified in sub-process 2.4 (Design frame and sample). It also includes the coordination of samples between instances of the same business process (e.g. to manage overlap or rotation), and between different processes using a common frame or register (e.g. to manage overlap or to spread response burden). Quality assurance and approval of the frame and the selected sample are also undertaken in this sub-process, though maintenance of underlying registers, from which frames for several statistical business processes are drawn, is treated as a separate business process. The sampling aspect of this sub-process is not usually relevant for processes based entirely on the use of pre-existing sources (e.g. administrative registers, web sites) as such processes generally create frames from the available data and then follow a census approach. Variables from administrative and other non-statistical sources of data can be used as auxiliary variables in the construction of sampling design.
4.2. Set up collection
69. This sub-process ensures that the people, processes and technology (e.g. web-based applications, GPS system) are ready to collect data and metadata, in all modes as designed. It takes place over a period of time, as it includes the strategy, planning and training activities in preparation for the specific instance of the statistical business process. Where the process is repeated regularly, some (or all) of these activities may not be explicitly required for each iteration. For one-off and new processes, these activities can be lengthy. For survey data, this sub-process includes:
- Preparing a collection strategy;
- Training collection staff;
- Training system using supervised machine learning techniques;
- Ensuring collection resources are available (e.g. laptops, collection apps, APIs);
- Agreeing on terms with any intermediate collection bodies, (e.g. sub-contractors for computer assisted telephone interviewing, web services);
- Configuring collection systems to request and receive the data;
- Ensuring the security of data to be collected;
- Preparing collection instruments (e.g. printing questionnaires, pre-filling them with existing data, loading questionnaires and data onto interviewers' computers, APIs, web scraping tools);
- Providing information for respondents (e.g. drafting letters or brochures explaining the purpose of the survey, notifying respondents when online reporting instruments will be made available);
- Translating of materials (e.g. into the different languages spoken or used in the country).
70. For non-survey sources, this sub-process ensures that the necessary processes, systems and confidentiality procedures are in place, to receive or extract the necessary information from the source. This includes:
- Evaluating requests to acquire the data and logging the request in a centralised inventory;
- Initiating contacts with organisations providing the data, and sending an introductory package with details on the process of acquiring the data;
- Checking detailed information about files and metadata with the data provider and receiving a test file to assess if data are fit for use;
- Arranging secure channels for the transmission of the data.
4.3. Run collection
71. This sub-process is where the collection is implemented. The different collection instruments are used to collect or gather the information which may include raw microdata or aggregates produced at the source, as well as any associated metadata. It can include the initial contact with providers and any subsequent follow-up or reminder actions. It may include manual data entry at the point of contact, or fieldwork management, depending on the source and collection mode. It records when and how providers were contacted, and whether they have responded. Depending on the geographical frame and the technology used, geo-coding 1 may need to be done at the same time as collection of the data by using inputs from GPS systems, putting a mark on a map, etc. This sub-process also includes the management of the providers involved in the current collection, ensuring that the relationship between the statistical organisation and data providers remains positive, and recording and responding to comments, queries and complaints. Proper communication with reporting units and minimisation of the number of non-respondents contribute significantly to a higher quality of the collected data.
72. For administrative, geographical or other non-statistical data, the provider is either contacted to send the information or sends it as scheduled. This process may be time consuming and might require follow-ups to ensure that data are provided according to the agreements. In the case where the data are published under an Open Data license and exist in machine-readable form, they may be freely accessed and used.
73. This sub-process may also include the monitoring of data collection and making any necessary changes to improve data quality. This includes generating reports, visualising and adjusting the acquisition process to ensure the data are fit for use. When the collection meets its targets, it is closed and a report on the collection is produced. Some basic checks of the structure and integrity of the information received may take place within this sub-process, (e.g. checking that files are in the right format and contain the expected fields).
4.4. Finalise collection
74. This sub-process includes loading the collected data and metadata into a suitable electronic environment for further processing. It may include manual or automatic data capture, for example, using clerical staff or optical character recognition tools to extract information from paper questionnaires, or converting the formats of files or encoding the variables received from other organisations. It may also include analysis of the metadata and paradata associated with collection to ensure the collection activities have met requirements. In cases where there is a physical collection instrument, such as a paper questionnaire, which is not needed for further processing, this sub-process manages the archiving of that material. When the collection instrument uses software such as an API or an app, this sub-process also includes the versioning and archiving of these.
Process Phase

75. This phase describes the processing of input data and their preparation for analysis. It is made up of sub-processes that integrate, classify, check, clean, and transform input data, so that they can be analysed and disseminated as statistical outputs. For statistical outputs produced regularly, this phase occurs in each iteration. The sub-processes in this phase can apply to data from both statistical and non-statistical sources (with the possible exception of sub-process 5.6 (Calculate weights), which is usually specific to survey data).
76. The "Process" and "Analyse" phases can be iterative and parallel. Analysis can reveal a broader understanding of the data, which might make it apparent that additional processing is needed. Sometimes the estimates being processed might be already published aggregates (undertaken according to a Revision Policy).
77. Activities within the "Process" and "Analyse" phases may also commence before the "Collect" phase is completed. This enables the compilation of provisional results where timeliness is an important concern for users, and increases the time available for analysis.
78. The “Process” phase is broken down into eight sub-processes (Figure 8), which may be sequential, from left to right, but can also occur in parallel, and can be iterative. These sub-processes are:
5.1. Integrate data
79. This sub-process integrates data from one or more sources. It is where the results of sub-processes in the "Collect" phase are combined. The input data can be from a mixture of external or internal sources, and a variety of the collection instruments, including extracts of administrative and other non-statistical data sources. Administrative data or other non-statistical sources of data can substitute for all or some of the variables directly collected from survey. This sub-process also includes harmonising or creating new figures that agree between sources of data. The result is a set of linked data. Data integration can include:
- Combining data from multiple sources, as part of the creation of integrated statistics such as national accounts;
- Combining geospatial data and statistical data or other non-statistical data;
- Data pooling, with the aim of increasing the effective number of observations of some phenomena;
- Matching or record linkage routines, with the aim of linking micro or macro data from different sources;
- Data fusion - integration followed by reduction or replacement;
- Prioritising, when two or more sources contain data for the same variable, with potentially different values.
80. Data integration may take place at any point in this phase, before or after any of the other sub-processes. There may also be several instances of data integration in any statistical business process. Following integration, depending on data protection requirements, data may be de-identified, that is stripped of identifiers such as name and address, to help to protect confidentiality.
5.2. Classify and code
81. This sub-process classifies and codes the input data. For example, automatic (or clerical) coding routines may assign numeric codes to text responses according to a pre-determined statistical classification to facilitate data capture and processing. Some questions have coded response categories on the questionnaires or administrative source of data, others are coded after collection using an automated process (which may apply machine learning techniques) or an interactive, manual process.
5.3. Review and validate
82. This sub-process examines data to identify potential problems, errors and discrepancies such as outliers, item non-response and miscoding. It can also be referred to as input data validation. It may be run iteratively, validating data against pre-defined edit rules, usually in a set order. It may flag data for automatic or manual inspection or editing. Reviewing and validating can apply to data from any type of source, before and after integration, as well as imputed data from sub-process 5.4 (Edit and impute). Whilst validation is treated as part of the “Process” phase, in practice, some elements of validation may occur alongside collection activities, particularly for modes such as computer assisted collection. Whilst this sub-process is concerned with detection and localisation of actual or potential errors, any correction activities that actually change the data is done in sub-process 5.4 (Edit and impute)
5.4. Edit and impute
83. Where data are considered incorrect, missing, unreliable or outdated, new values may be inserted or outdated data may be removed in this sub-process. The terms editing and imputation cover a variety of methods to do this, often using a rule-based approach. Specific steps typically include:
- Determining whether to add or change data;
- Selecting the method to be used;
- Adding/changing data values;
- Writing the new data values back to the data set, and flagging them as changed;
- Producing metadata on the editing and imputation process.
5.5. Derive new variables and units
84. This sub-process derives data for variables and units that are not explicitly provided in the collection, but are needed to deliver the required outputs. It derives new variables by applying arithmetic formulae to one or more of the variables that are already present in the dataset, or applying different model assumptions. This activity may need to be iterative, as some derived variables may themselves be based on other derived variables. It is therefore important to ensure that variables are derived in the correct order. New units may be derived by aggregating or splitting data for collection units, or by various other estimation methods. Examples include deriving households where the collection units are persons or enterprises where the collection units are legal units.
5.6. Calculate weights
85. This sub-process creates weights for unit data records according to the methodology developed in sub-process 2.5 (Design processing and analysis). For example, weights can be used to "gross-up" data to make them representative of the target population (e.g. for sample surveys or extracts of scanner data), or to adjust for non-response in total enumerations. In other situations, variables may need weighting for normalisation purposes. It may also include weight correction for benchmarking indicators (e.g. known population totals).
5.7. Calculate aggregates
86. This sub-process creates aggregate data and population totals from microdata or lower-level aggregates. It includes summing data for records sharing certain characteristics (e.g. aggregation of data by demographic or geographic classifications), determining measures of average and dispersion, and applying weights from sub-process 5.6 (Calculate weights) to derive appropriate totals. In the case of statistical outputs which use sample surveys, sampling errors corresponding to relevant aggregates may also be calculated in this sub-process.
5.8. Finalise data files
87. This sub-process brings together the results of the other sub-processes in this phase in a data file (usually macro-data), which is used as the input to the "Analyse" phase. Sometimes this may be an intermediate rather than a final file, particularly for business processes where there are strong time pressures, and a requirement to produce both preliminary and final estimates.
Analyse Phase

88. In this phase, statistical outputs are produced and examined in detail. It includes preparing statistical content (including commentary, technical notes, etc.), and ensuring outputs are “fit for purpose” prior to dissemination to users. This phase also includes the sub-processes and activities that enable statistical analysts to understand the data and the statistics produced. The outputs of this phase could also be used as an input to other sub-processes (e.g. analysis of new sources as input to the “Design” phase). For statistical outputs produced regularly, this phase occurs in every iteration. The "Analyse" phase and sub-processes are generic for all statistical outputs, regardless of how the data were sourced.
89. The "Analyse" phase is broken down into five sub-processes (Figure 9), which are generally sequential, from left to right, but can also occur in parallel, and can be iterative. These sub-processes are:
6.1. Prepare draft outputs
90. This sub-process is where the data from sub-processes 5.7 (Calculate aggregates) and 5.8 (Finalise data files) are transformed into statistical outputs such as indexes, seasonally adjusted statistics, e.g. trend, cycle, seasonal and irregular components, accessibility measures, etc., as well as the recording of quality characteristics such as coefficients of variation. The preparation of maps, GIS outputs and geo-statistical services can be included to maximise the value and capacity to analyse the statistical information.
6.2. Validate outputs
91. This sub-process is where statisticians validate the quality of the outputs produced, in accordance with a general quality framework and with expectations. This sub-process includes activities involved with the gathering of intelligence, with the cumulative effect of building up a body of knowledge about a specific statistical domain. This knowledge is then applied to the current collection, in the current environment, to identify any divergence from expectations and to allow informed analyses. Validation activities can include:
- Checking that the population coverage and response rates are as required;
- Comparing the statistics with previous cycles (if applicable);
- Checking that the associated metadata, paradata and quality indicators are present and in line with expectations;
- Checking geospatial consistency of the data;
- Confronting the statistics against other relevant data (both internal and external);
- Investigating inconsistencies in the statistics;
- Performing macro editing;
- Validating the statistics against expectations and domain intelligence.
6.3. Interpret and explain outputs
92. This sub-process is where the in-depth understanding of the outputs is gained by statisticians. They use that understanding to interpret and explain the statistics by assessing how well the statistics reflect their initial expectations, viewing the statistics from all perspectives using different tools and media, and carrying out in-depth statistical analyses such as time-series analysis, consistency and comparability analysis, revision analysis (analysis of the differences between preliminary and revised estimates), analysis of asymmetries (discrepancies in mirror statistics), etc.
6.4. Apply disclosure control
93. This sub-process ensures that the data (and metadata) to be disseminated do not breach the appropriate rules on confidentiality according to either organisation policies and rules, or to the process-specific methodology created in sub-process 2.5 (Design processing and analysis). This may include checks for primary and secondary disclosure, as well as the application of data suppression or perturbation techniques and output checking. The degree and method of statistical disclosure control may vary for different types of outputs. For example, the approach used for microdata sets for research purposes will be different to that for published tables, finalised outputs of geospatial statistics or visualisations on maps.
6.5. Finalise outputs
94. This sub-process ensures the statistics and associated information are fit for purpose and reach the required quality level and are thus ready for use. It includes:
- Completing consistency checks;
- Determining the level of release, and applying caveats;
- Collating supporting information, including interpretation, commentary, technical notes, briefings, measures of uncertainty and any other necessary metadata;
- Producing the supporting internal documents;
- Conducting pre-release discussion with appropriate internal subject matter experts;
- Translating the statistical outputs in countries with multilingual dissemination;
- Approving the statistical content for release.
Disseminate Phase
95. This phase manages the release of the statistical products to users. It includes all activities associated with assembling and releasing a range of static and dynamic products via a range of channels. These activities support users to access and use the products released by the statistical organisation. For statistical products produced regularly, this phase occurs in each iteration.
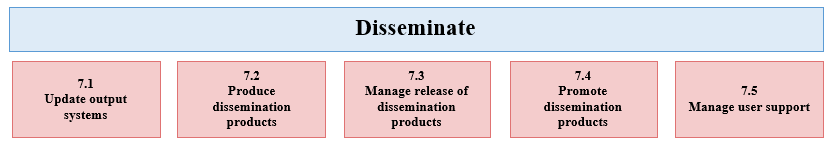
96. The “Disseminate” phase is broken down into five sub-processes (Figure 10), which are generally sequential, from left to right, but can also occur in parallel, and can be iterative. These sub-processes are:
7.1. Update output systems
97. This sub-process manages the update of systems (e.g. databases) where data and metadata are stored ready for dissemination purposes, including:
- Formatting data and metadata ready to be put into output systems;
- Loading data and metadata into output systems;
- Ensuring data are linked to the relevant metadata.
98. Formatting, loading and linking of metadata should preferably mostly take place in earlier phases, but this sub-process includes a final check that all of the necessary metadata are in place ready for dissemination.
7.2. Produce dissemination products
99. This sub-process produces the dissemination products, as previously designed in sub-process 2.1 (Design outputs), to meet user needs. They could include printed publications, press releases and websites. The products can take many forms including interactive graphics, tables, maps, public-use microdata sets, linked open data and downloadable files. Typical steps include:
- Preparing the product components (explanatory texts, tables, charts, maps, quality statements etc.);
- Assembling the components into products;
- Editing the products and checking that they meet publication standards.
7.3. Manage release of dissemination products
100. This sub-process ensures that all elements for the release are in place including managing the timing of the release. It includes briefings for specific groups such as the press or ministers, as well as the arrangements for any pre-release embargoes. It also includes the provision of products to subscribers, and managing access to confidential data by authorised user groups, such as researchers. Sometimes an organisation may need to retract a product, for example, if an error is discovered. This is also included in this sub-process.
7.4. Promote dissemination products
101. Whilst marketing in general can be considered to be an overarching process, this sub-process concerns the active promotion of the statistical products produced in a specific statistical business process, to help them reach the widest possible audience. It includes the use of customer relationship management tools, to better target potential users of the products, as well as the use of tools including websites, wikis and blogs to facilitate the process of communicating statistical information to users.
7.5. Manage user support
102. This sub-process ensures that user queries and requests for services such as microdata access are recorded, and that responses are provided within agreed deadlines. These queries and requests should be regularly reviewed to provide an input to the overarching quality management process, as they can indicate new or changing user needs. Replies to user requests can also be used to populate a knowledge database or a “Frequently Asked Questions” page, that is made publicly available, thus reducing the burden of replying to repeated and/or similar requests from external users. This sub-process also includes managing support to any partner organisations involved in disseminating the products.
Evaluate Phase
103. This phase manages the evaluation of a specific instance of a statistical business process, as opposed to the more general overarching process of statistical quality management described in Section VI (Overarching Processes). It can take place at the end of the instance of the process, but can also be done on an ongoing basis during the statistical production process. It relies on inputs gathered throughout the different phases. It includes evaluating the success of a specific instance of the statistical business process, drawing on a range of quantitative and qualitative inputs, and identifying and prioritising potential improvements.
104. For statistical outputs produced regularly, evaluation should, at least in theory, occur for each iteration, determining whether future iterations should take place, and if so, whether any improvements should be implemented. However, in some cases, particularly for regular and well established statistical business processes, evaluation might not be formally carried out for each iteration. In such cases, this phase can be seen as providing the decision as to whether the next iteration should start from the “Specify Needs” phase, or from some later phase (often the “Collect” phase).
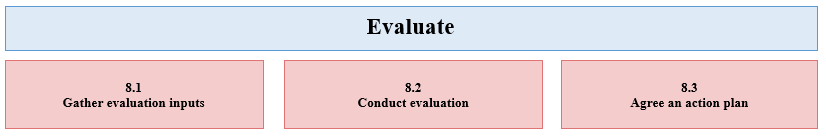
105. The “Evaluate” phase is broken down into three sub-processes (Figure 11), which are generally sequential, from left to right, but can also occur in parallel, and can be iterative. These sub-processes are:
8.1. Gather evaluation inputs
106. Evaluation material can be produced in any other phase or sub-process. It may take many forms, including feedback from users, process metadata (paradata), system metrics, and staff suggestions. Reports of progress against an action plan agreed during a previous iteration may also form an input to evaluations of subsequent iterations. This sub-process gathers all of these inputs, compiles quality indicators and makes them available for the person or team producing the evaluation. The collection of some of these evaluation materials can be automated and take place in a continuous way throughout the whole process, as defined by the quality framework (see Quality Management in Section VI). On the other hand, for the evaluation of certain processes it can be necessary to perform specific activities such as small surveys, (e.g. post-enumeration surveys, re-interview studies, survey on effectiveness of dissemination).
8.2. Conduct evaluation
107. This sub-process analyses the evaluation inputs, compares them to the expected/target benchmarking results (when available), and synthesises them into an evaluation report or control dashboard. The evaluation can take place at the end of the whole process (ex-post evaluation) for selected activities, during its execution in a continuous way, or throughout the process, thus allowing for quick fixes or continuous improvement. The resulting report should note any quality issues specific to this iteration of the statistical business process as well as highlight any deviation of performance metrics from expected values, and should make recommendations for changes if appropriate. These recommendations can cover changes to any phase or sub-process for future iterations of the process, or can suggest that the process is not repeated.
8.3. Agree an action plan
108. This sub-process brings together the necessary decision-making power to form and agree an action plan based on the evaluation report. It should also include consideration of a mechanism for monitoring the impact of those actions, which may, in turn, provide an input to evaluations of future iterations of the process.
- In this document, geo-coding is defined as “assigning codes related to geographical places” while geo-referencing is defined more generally as “relating data with where the fact happens” ↩