59. The GSIM Concepts and Structures groups include information objects which are foundational to the statistical Business Process. That is, these objects are the conceptual and structural objects which are used as the Process Inputs and Process Outputs to the process. The Concepts area of GSIM includes the sets of information objects that describe and define the terms used when talking about the real-world phenomena that the statistics measure in their practical implementation. The Structures area includes the set of information objects used in relation to data and referential metadata and their structures. The objects described in this section of the document are used to provide information that helps users of data and metadata understand the results of Business Processes and Statistical Programs.
A: Concepts

Figure 10. Concepts
60. At an abstract level, a Concept is defined in GSIM as a 'unit of thought differentiated by characteristics'. Concepts are used in different ways throughout the statistical lifecycle, and each different role of a Concept is described using a different information object (which are subtypes of Concept). A Concept can be used in these situations:
(a) As a characteristic. The Concept is used by a Variable to describe the particular characteristic that is to be measured about a Population. For example, to measure the Concept of gender in a population of adults in the Netherlands, the Variable combines this Concept with the Unit Type person.
(b) As a Unit Type or a Population. To describe the set of objects that information is to be obtained about in a statistical survey. For example, the Population of adults in Netherlands, based on the Unit Type of persons.
(c) As a Category to further define details about a Concept. For example, Male and Female for the Concept of Gender. Codes can be linked to a Category via a Node (i.e., a Code Item or Classification Item), for use within a Code List or Statistical Classification.
61. Concept Systems are sets of Concepts which are structured by the relations between those Concepts. A Subject Field groups Concept Systems on the basis of their field of special knowledge (for example, labour market, tourism).
B. Population

Figure 11. Populations and Units
62. There are several kinds of Populations depending on what Process Step it is used in. For example a statistical organization may refer to a target, survey, frame, or analysis population. The objects of interest in a statistical process are Units (for example, a particular person or a business). Data are collected about Units. There are two ways in which a unit is specified in the model. A Unit is an individual entity associated with a Population about which information may be obtained. A Unit Type (for example persons or businesses) is a way of identifying an abstract type of Unit that a Variable is measuring.
C. Node and Node Set

Figure 12. Node and Node Set inheritance
63. A Category is a particular type of Concept whose role is to define a characteristic. There are three ways in which a Category can be used. In GSIM, these are described as the three subtypes of Node - Category Item, Code Item and Classification Item. Categories are grouped into Node Sets based on the way in which it can be used. There are three subtypes of these groups (Node Sets) - Category Sets, Code Lists and Statistical Classifications.
64. A Category Set is a set of Category Items, which contain the meaning of a Category without any associated representations. An example of a Category Set is: Male, Female.
65. In a Code List, the Code Items contain the meaning of the Categories combined with a Code representation. An example of a Code List is: 1. Male, 2. Female.
66. A Statistical Classification is similar to a Code List. It combines the meaning of the Category with a Code representation. However the content of a Statistical Classification must fulfil certain criteria and have a certain status. The Classification Items must be mutually exclusive and jointly exhaustive for the Level at which they exist at in the Statistical Classification. An example of a Statistical Classification is: 1. Male, 2. Female, 3. Intersex.
67. A Code List does not have to satisfy the same criteria as the Statistical Classification. The Code List can also contain additional Code Items to support a particular use of the Code List, such as the inclusion of missing values.
68. The similarities between Statistical Classifications, Code Lists and Category Sets are inherent through their link (as subtypes) to Node Set. Similarly, the three types of item which make up each group (Classification Item, Code Item and Category Item respectively) are subtypes of Node.
D. Statistical Classification
69. This section describes a Statistical Classification and its related management objects, as a particular view of the Node Set portion of GSIM. Further detail about Statistical Classifications in particular can be found in the GSIM Statistical Classification Model.

Figure 13. Statistical Classifications
70. The figure above provides an overview of the objects relating to Statistical Classifications.
71. A Classification Family is a group of Classification Series related based on a common Concept (e.g. economic activity). A Classification Series is an ensemble of one or more Statistical Classifications that are based on the same Concept. The Statistical Classifications in a Classification Series are related to each other as versions or updates. Typically, these Statistical Classifications have the same name, for example International Standard Industrial Classification of All Economic Activities (ISIC), or International Standard Industrial Classification of Occupations (ISCO).
72. A Statistical Classification is a set of Categories which may be assigned to one or more Represented Variables used in the production and dissemination of statistics. The Categories at each Level of the classification structure must be mutually exclusive and jointly exhaustive of all objects/units in the population of interest. One example of a Statistical Classification is ISIC rev 4.
73. The Categories are defined to reference one or more characteristics of a particular population of interest. A Statistical Classification may have a flat, linear structure or may be hierarchically structured, such that all Categories at lower Levels are sub-categories of a Category at the next Level up.
74. A Statistical Classification has Categories that are represented by Classification Items. These Classification Items are organised into Levels determined by the hierarchy. A Level is a set of Concepts that are mutually exclusive and jointly exhaustive; for example: section, division, group and class in ISIC rev 4.
75. A Classification Item combines the meaning from a Category, its representation (i.e., Code) and additional information in order to meet the Statistical Classification criteria, for example "A- agriculture, forestry and fishing" and accompanying explanatory text such as information about what is included and excluded.
76. Statistical Classifications can be versions or variants. A variant type of Statistical Classification is based on a version type of Statistical Classification. In a variant the Categories of the version may be split, aggregated or regrouped to provide additions or alternatives to the standard order and structure of the original Statistical Classification.
77. A Correspondence Table is a set of Maps. These Maps link a Classification Item in a Statistical Classification with a corresponding Classification Item in another Statistical Classification via the Concept which is common to both Classification Items. For example, in a Correspondence Table displaying the relationship between ISIC rev 4 and the North American Industry Classification System (NAICS 2007 (US)), "0112 - Growing of Rice" in ISIC Rev 4 is related to "111160 - Rice Farming" in NAICS through the common concept of "growing rice".
78. A Classification Index shows the relationship between text found in statistical data sources (responses to survey questionnaires, administrative records) and one or more Statistical Classifications. A Classification Index may be used to assign the Codes for Classification Items to observations in Statistical Programs.
79. A Classification Index Entry is a word or short text (e.g. the name of a locality, an economic activity or an occupational title) describing a type of Concept to which a Classification Item applies, together with the Code of the corresponding Classification Item. Each Classification Index Entry typically refers to one item of the Statistical Classification. Although a Classification Index Entry may be associated with a Classification Item at any Level of a Statistical Classification, they are normally associated with Classification Items at the lowest Level.
E. Variable

Figure 14. Variable
80. When used as part of a Business Process, a Unit Type defining a Population is associated with a characteristic. The association of Unit Type and a Concept playing the role of a characteristic is called a Variable (see Figure 14). For example, if the Population is adults in Netherlands, then a relevant Variable might be the Concept educational attainment combined with the Unit Type person.
81. The Variable (person's educational attainment) does not include any information on how the resulting value may be represented. This information (the Value Domain) is associated with the Represented Variable. This distinction promotes the reuse of a Variable definition when what is being measured is conceptually the same but it is represented in a different manner.
82. A derived variable is created by a Process Step that applies a Process Method to one or more Process Inputs (Variables). The Process Output of the Process Step is the derived variable.
83. A Conceptual Domain is associated with a Variable. It has two subtypes: Described Conceptual Domain and Enumerated Conceptual Domain. An Enumerated Conceptual Domain, in combination with a Category Set, contains information on the semantics of the Categories used by the Variable.
F. Represented Variable
84. GSIM assists users in understanding both the meaning and the concrete data-representation of the object. Accordingly, GSIM distinguishes between conceptual and representation levels in the model, to differentiate between the objects used to conceptually describe information, and those that are representational.
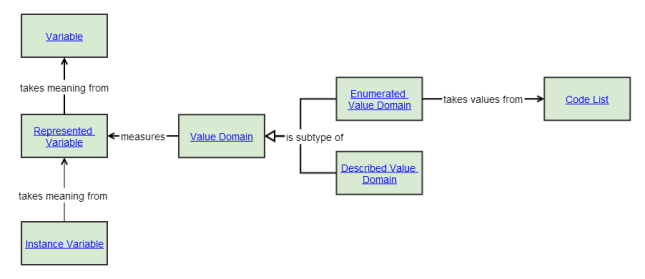
Figure 15. Represented Variable
85. The Represented Variable (see Figure 15) adds information that describes how the resulting values may be represented through association with a Value Domain. While Conceptual Domains are associated with a Variable, Value Domains are associated with a Represented Variable. These two domains are distinguished because GSIM separates the semantic aspect (Conceptual Domain) and the representational aspect (Value Domain).
86. Both the Enumerated Value Domain and the Described Value Domain (the two subtypes of Value Domain) give information on how the Represented Variable is represented. The Enumerated Value Domain does this in combination with a Code List, while the Described Value Domain provides a definition of how to form the values, rather than explicitly listing them.
87. The Value Domain includes data type and unit of measure information. The data type contains information on the allowed computations one may perform on the Datum (nominal-, ordinal-, interval-data, etc.), while the unit of measure (Tonnes, Count of _, Dollars, etc.) refines the measure of the _Value Domain. For example gender codes lead to nominal statistical data, whereas age values in years lead to interval data.
G. Instance Variable

Figure 16. Instance Variable
88. An Instance Variable (see Figure 16) is a Represented Variable that has been associated with a Data Set. This can correspond to a column of data in a database. For example, the "age of all the US presidents either now (if they are alive) or the age at their deaths" is a column of data described by an Instance Variable, which is a combination of the Represented Variable describing "Person's Age" and the Value Domain of "decimal natural numbers (in years)".
89. A Datum is contained within a Data Point in a Data Set. It may be defined by the measure of a Value Domain associated with a describing Instance Variable, combined with the link to a Unit (for unit data), or a Population (for dimensional data).
H. Information Resources

Figure 17. Information Resources
90. Statistical organizations collect, process, analyse and disseminate Information Sets, which are either data (Data Sets) or referential metadata (Referential Metadata Sets).
91. Each Data Set must be structured according to a Data Structure (for example, a structure for Balance of Payments, Demography, Tourism, Education etc.). In the same way, a Referential Metadata Set must be structured according to a Referential Metadata Structure (e.g. an organization's quality framework).
92. Information Resources contain Information Sets. The main purpose of the Information Resource is to aid discovery and management of Information Sets, by providing location and other information relevant to these tasks. There are two types of Information Resource. Data Resources contain Data Sets, and Referential Metadata Resources contain Referential Metadata Sets.
I. Data Sets

Figure 18. Data Sets
93. A Data Set has Data Points. A Data Point is placeholder (for example, an empty cell in a table) in a Data Set for a Datum. The Datum is the value that populates that placeholder (for example, an item of factual information obtained by measurement or created by a production process). A Data Structure describes the structure of a Data Set by means of Data Structure Components (Identifier Components, Measure Components and Attribute Components). These are all Represented Variables with specific roles.
94. Data Sets come in different forms, for example as Administrative Registers, Time Series, Panel Data, or Survival Data, just to name a few. The type of a Data Set determines the set of specific attributes to be defined, the type of Data Structure required (Unit Data Structure or Dimensional Data Structure), and the methods applicable to the data.
95. For instance, an administrative register is characterized by a Unit Data Structure, with attributes such as its original purpose or the last update date of each record. It contains a record identifying variable, and can be used to define a Population that is used as a frame, to replace or complement existing surveys, or as an auxiliary input to imputation. Record matching is an example of a method specifically relevant for registers.
96. An example for a type of Data Set defined by a Dimensional Data Structure is a time series. It has specific attributes such as frequency and type of temporal aggregation and specific methods, for example, seasonal adjustment, and must contain a temporal variable.
97. Unit data and dimensional data are perspectives on data. Although not typically the case, the same set of data could be described both ways. Sometimes what is considered dimensional data by one organization (for example, a national statistical office) might be considered unit data by another (for example, Eurostat where the unit is the member state). A particular collection of data need not be considered to be intrinsically one or the other. This matter of perspective is conceptual. In GSIM, the distinction is that a Unit Data Set contains data about Units and a Dimensional Data Set contains data about either Units or Populations.
98.GSIM states that all Data Sets must have a structure associated with them. There are, however, cases where a Data Set has no structure – because it was not stored or lost, or it is not known. This type of data may become more prevalent for statistical organizations in the future. In order for a statistical organization to use this data, the data will need to go through a process of being structured. For example, in a case of investigation of new potential data sources for a new or changed Statistical Need, there will need to be a process where these new data are analyzed to determine their content and structure. It is only after this process that these new Data Sets can be described using the Data Structure objects. This unstructured data is currently described by GSIM as a Process Input. Organizations could extend GSIM to capture this use case by creating a new subtype of the Information Set object.
J. Dimensional and Unit Data Structures

Figure 19. Data Structures
99. A Dimensional Data Structure describes the structure of a Dimensional Data Set by means of Represented Variables with specific roles.
100. The combination of dimensions contained in a Dimensional Data Structure creates a key or identifier of the measured values. For instance, country, indicator, measurement unit, frequency, and time dimensions together identify the cells in a cross-country time series with multiple indicators (for example, gross domestic product, gross domestic debt) measured in different units (for example, various currencies, percent changes) and at different frequencies (for example, annual, quarterly). The cells in such a multi-dimensional table contain the observation values.
101. A measure is the variable that provides a container for these observation values. It takes its semantics from a subset of the dimensions of the Dimensional Data Structure. In the previous example, indicator and measurement unit can be considered as those semantics-providing dimensions, whereas frequency and time are the temporal dimensions and country the geographic dimension. An example for a measure in addition to the plain 'observation value' could be 'pre-break observation value' in the case of a time series. Dimensions typically refer to Represented Variables with coded Value Domains (Enumerated Value Domains), measures to Represented Variables with uncoded Value Domains (Described Value Domains).
102. A Unit Data Structure describes the structure of a Unit Data Set by means of Represented Variables with specific roles. It distinguishes between the logical and physical structure of a Data Set. A Unit Data Set may contain data on more than one type of Unit, each represented by its own record type.
103. Logical Records describe the structure of such record types, independent of physical features by referring to Represented Variables that may include a unit identification (for example, household number). A Record Relationship defines source-target relations between Logical Records.
K. Referential Metadata Sets

Figure 20. Referential Metadata Sets
104. Information that describes the characteristics of statistics is "referential metadata". These metadata can be broad, such as about an entire Statistical Program, or narrow, such as about an individual Data Point. Referential Metadata Resources, a special type of Information Resource, provide top-level containers for referential metadata.
105. A Referential Metadata Set organizes referential metadata, whose structure is defined in a Referential Metadata Structure. A Referential Metadata Structure specifies both the Referential Metadata Subject for which referential metadata may be included, and a structured list of Referential Metadata Attributes that can be reported or authored for the given Referential Metadata Subject.
106. These subjects may be any GSIM object type, or any Data Point or set of Data Points created from a specific Data Structure.
- Example of a GSIM object type as a Referential Metadata Subject: Product for which there is a list specified in a Value Domain. The Value Domain specifies the list of actual Products for which reference metadata can be reported or authored using this Referential Metadata Structure.
- Examples of Referential Metadata Attributes include status, coverage, methodology description, and quality indicator.
107. A Referential Metadata Set contains the actual referential metadata reported or authored. The Referential Metadata Subject Item identifies the actual object e.g. actual Product such as Balance of Payments and International Investment Position, Australia, June 2013, or actual Data Points such as the Data Points for a single region within a Data Set covering all regions for a country.
108. The Referential Metadata Content Item is the actual metadata for the identified Referential Metadata Subject Item. Each Referential Metadata Content Item contains the reported referential metadata for one Referential Metadata Attribute specified in the Referential Metadata Structure.
Table 1. Example of Use of GSIM Referential Metadata Objects
GSIM Object | ONS Statistical bulletin: Public Sector Finances, October 2013:Table 1 |
Referential Metadata Structure | Implicit |
Referential Metadata Subject | Data Structure Component |
Referential Metadata Attribute | Table footnote |
Referential Metadata Set | Footnotes |
Referential Metadata Subject Item | Data Structure Component: £billion; PS Current Budget; PS Current Budget ex APF;… |
Referential Metadata Content Item | Footnoted text |