 (word version)
Common Statistical Production Architecture:
Proof of Concept
(December 2013)
This document describes the Proof of Concept which was undertaken in 2013 as part of the Common Statistical Production Architecture Project.
This work is licensed under the Creative Commons Attribution 3.0 Unported License. To view a copy of this license, visit http://creativecommons.org/licenses/by/3.0/. If you re-use all or part of this work, please attribute it to the United Nations Economic Commission for Europe (UNECE), on behalf of the international statistical community.
1. In 2013, the High Level Group for the Modernization of Statistical Production and Services (HLG) sponsored a project to create the Common Statistical Production Architecture.
2. The project has two important strands. The first strand concerns the development of the necessary architecture frameworks, whilst the second is concerned with practical implementation.
The Common Statistical Production Architecture (CSPA)
3. The CSPA is the industry architecture for the official statistics industry. An industry architecture is a set of agreed common principles and standards designed to promote greater interoperability within and between the different stakeholders that make up an "industry", where an industry is defined as a set of organizations with similar inputs, processes, outputs and goals (in this case official statistics).
4. The CSPA provides a reference architecture for official statistics. It describes:
- What the official statistical industry wants to achieve – This is the goals and vision (or future state).
- How the industry can achieve this – This is the principles that guide decisions on strategic development and how statistics are produced.
- What the industry will have to do - The industry will need to adopt an architecture which will require them to comply with the CSPA.
5.Work on the architecture commenced in April 2013 when a sprint session was held at Statistics Canada to discuss what the architecture would be. The output of that Sprint was a v0.1 of the architecture which was circulated for public review during May 2013.
6.Over the following four months, the architecture was updated a number of times to reflect the feedback from the community and learnings from the Proof of Concept work. The architecture was released for further stakeholder review during October. CSPA v1.0 1 was released to the public in December 2013.
The CSPA Proof of Concept
7.The Proof of Concept produced the first CSPA Statistical Services. The work was progressed in parallel to the work undertaken to develop the architecture. The purpose of doing this was to test the architecture and provide quick feedback into the development of the architecture.
What Statistical Services were involved in the Proof of Concept?
8.CSPA is based on an architectural style called Service Oriented Architecture (SOA). This style focuses on Services (or Statistical Services in this case). A service is a representation of a real world business activity with a specified outcome. It is self-contained and can be reused by a number of business processes (either within or across statistical organizations).
9.Statistical Services are defined and have invokable interfaces that are called to perform business processes. The Statistical Services that are shared or reused across statistical organizations might be new Statistical Services that are built to comply with CSPA or legacy/existing tools wrapped to be Statistical Services which comply with the architecture.
10.Given the short timeframe in which to complete the Proof of Concept, it was decided that the Statistical Services for the Proof of Concept could not be built from scratch. Instead, the organisations involved in the project were consulted to find suitable candidate tools/applications that could be wrapped and exposed as Statistical Services.
11. The five identified tools are listed below.
- Blaise: A data collection, data editing and data processing tool developed by Statistics Netherlands. For the Proof of Concept only the collection function was involved.
- Editrules: An error localization tool developed by a staff member at Statistics Netherlands and made available under GPL and can be obtained through the CRAN website.
- CANCEIS (CANadian Census Edit and Imputation System): An editing tool used for error localization and imputation developed by Statistics Canada.
- GCode: A generalized automated and assisted coding tool developed by Statistics Canada.
- Statistical Coding Service: A coding tool developed by Statistics New Zealand.
12. The level of reusability promised by the adoption of a Service Oriented Architecture is dependent on standard definitions of the services. CSPA has three layers to the description of any service. These are shown in Figure 1. 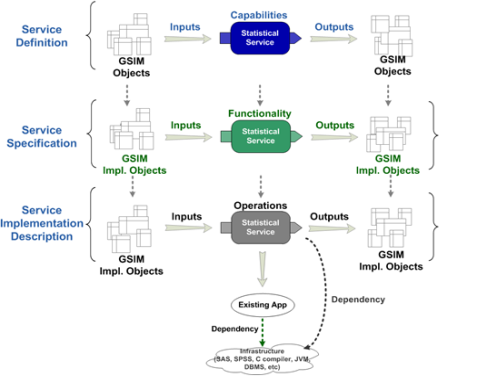
Figure 1. Service interfaces at different levels of abstraction
13. Statistical Service Definition is at a conceptual level. In this document, the capabilities of a Statistical Service are described in terms of the GSBPM sub process that it relates to, the business function that it performs and GSIM information objects which are the inputs and outputs.
14. Statistical Service Specification is at a logical level. In this layer, the capabilities of a Statistical Service are fleshed out into business functions that have GSIM implementation level objects as inputs and outputs. This document also includes metrics and methodologies.
15. Statistical Service Implementation Description is at an implementation (or physical) level. In this layer, the functions of the Statistical Service are refined into detailed operations whose inputs and outputs are GSIM implementation level objects.
Roles in CSPA
16. Using CSPA will create new functional roles within a statistical organization. These roles are shown in Figure 1 and detailed descriptions of them can be found in CSPA v1.0. For the Proof of Concept the roles of Designer, Builder and Assembler were undertaken. The following sections describe these functions.
Figure 2. Roles in CSPA
Designer
17. The CSPA Design Sprint was held at Istat in June. At this Sprint, the design work for the Proof of Concept was undertaken. The sprint participants took on the role of Designer for the five Statistical Services involved in the Proof of Concept. 
Figure 3. Linkages between layers of of abstraction and roles.
18. As shown in Figure 3, the Designer role creates the Service Definitions and Service Specifications. The five tools which were to be wrapped for the Proof of Concept performed four business functions:
- Run Collection (Blaise)
- Error Localization (Edit Rules)
- Editing and Imputation (CANCEIS)
- Autocoding (GCode and Statistical Classification Service)
19. GCode and the Statistical Classification Service performed the same business function – so at the conceptual and logical level they are the same service. As such, four Statistical Services were defined and specified during the Sprint. Annex 1 includes the Service Definition and Specification for the Autocoding Statistical Service.
Builders
20. Organizations involved in the wrapping of one of the candidate tools will performed the role of "Service Builders". Five statistical organizations performed this role during the Proof of Concept, as shown in Table 1.
Table 1. Proof of Concept Service Builders
Service Builder | Statistical Service |
Australia | Run Collection Statistical Service (Blaise) |
Italy | Error Localization Statistical Service (EditRules) |
Canada | Editing and Imputation Statistics Service (CANCEIS) |
Netherlands | Autocoding Service 1 (GCode) |
New Zealand | Autocoding Service 2 (Statistical Classification Service) |
21.There were many people involved in building each Statistical Service. Figure 4 provides an example by showing the different parties involved in building Autocoding Service 1. 
Figure 4. Stakeholders involved building Autocoding Service 1.
22.The Service Builders began work in July and finished building all the Statistical Services by September.
Assemblers
23. Within each statistical organization, there needs to be an infrastructural environment in which the generic services can be combined and configured to run as element of organization specific processes. This environment is not part of CSPA. CSPA assumes that each statistical organization has such an environment and makes statements about the characteristics and capabilities that such a platform must have in order to be able to accept and run Statistical Services that comply with CSPA.
24.The Statistical Services were implemented (in various combinations, as shown in Figure 5) into three statistical organizations (Italy, New Zealand and Sweden). These organizations performed the role of Service Assembler for the Proof of Concept. New Zealand and Sweden have similar environments and Italy has a different one.

Figure 5. Service Assemblers for CSPA Proof of Concept
25.The Service Assemblers began work in September and finished in November.
The resulting Statistical Services were implemented (in various combinations) into three hosting organizations (Istat, Statistics New Zealand and Statistics Sweden).
What did the Proof of Concept prove?
26. The PoC aimed to test the architecture and obtain practical feedback on it. It experimented with some of the key uses of the architecture.
Table 2. The aims and results of the Proof of Concept
Aim | Result |
CSPA is practical and can be implemented by various organizations in a consistent way | The statistical organizations involved were successful in building CSPA Statistical Services. |
CSPA does not prescribe the technology platform an agency requires | Statistics New Zealand and Istat have different infrastructural environments. Both organisations were successfully able to implement Autocoding Service 2 into their environments. |
You can fit CSPA Statistical Services into existing processes | Statistics New Zealand had an existing implementation of CANCEIS. They were able to implement the Editing and Imputation Service (i.e. a wrapped CANCEIS) into their environment. |
You can swap out CSPA compliant services easily | Statistics New Zealand implemented both Auto Coding Service 1 and Autocoding Service 2 into their environment. It was very easy to "swap out" the services without the need for significant IT input. |
Reusing the same statistical service by configuration | Statistics Sweden in their implementation of the Run Collection Service showed that they could configure both the environment and Statistical Service for different surveys. |
Lesson learnt during the Proof of Concept.
27.The CSPA Proof of Concept was successful in proving what it set out to prove. There were a number of lessons learned from the process. These are described below.
It is possible!
28. The Proof of Concept showed that CSPA is a viable approach to take for statistical organisations. Having tested the architecture, some of the real issues are now known and there is a tested foundation to move forward from. One quote from a business perspective on the Proof of Concept was:
"The proof-of-concept form of working with these concepts is in itself very interesting. We can quickly gain insight to both problems and possibilities"
International collaboration is a trade to be mastered
29. The on-going contact with colleagues over the globe is stimulating and broadens the understanding. The discussion forum on the CSPA wiki was useful for discussing and progressing issues.
30. However, the ability to undertake trouble shooting through the installation / configuration period was made difficult by the time zone differences. It meant that simple problems often took a number of days to resolve.
Roles
31. The separation of design, build, assemble functions worked very well. However, due to the limited time spent focussed on the Design role (limited to the 1 week design sprint), there was a blurring of the Designer and Builder roles. The Service Builders found in some cases that they had to tighten up the design specifications that they were given in order to complete the build work.
Licences
32. Each of the Service Builders and Service Assemblers needed licences for the tools that were wrapped. This was both a challenge and an opportunity. Obtaining the licences took some time and caused (small) delays in starting work. This was not a big problem given the small scale of the Proof of Concept. However, in the future, if an organisation that owns a Statistical Service has to provide licences for every party who wants to try the service, this could be become onerous.
33. Some organisations had processes in place to provide licences and some did not. At least one organisation created a process that they will be able to use for future collaborations.
Required knowledge about the Statistical Service
34. The Proof of Concept chose to wrap existing tools into Statistical Services for pragmatic reasons. The wrapping did introduce some complexity. In some cases, the tools being wrapped by Service Builders were not developed by the organisation performing the role of Service Builder. Building service wrappers with meaningful interfaces requires in depth knowledge of the tool being wrapped.
35. The Service Assemblers also needed in depth knowledge of Service that they were implementing. Support is required to implement a Statistical Service built by another organization.
Required knowledge about GSIM Implementation standards
36. The Proof of Concept was one of the first real world uses of GSIM Implementation. Support was provided to Service Builders by DDI experts as well as participants in the HLG Frameworks and Standards for Statistical Modernisation project. However, Service Builders needed knowledge of GSIM and GSIM Implementation standards (DDI in the case of the Proof of Concept). In some cases, DDI needed to be extended. It took time explore the how these extensions should be done.
Conclusion
37.The CSPA project was successful in providing the official statistical industry with the first version of an industry architecture that was been tested and shown to be viable. If you are interested in further details about the Proof of Concept, cases studies from the Service Builder and Service Assembler for each of the Statistical Services are available on the wiki 1 . Short videos showing the Statistical Services in action are also available.
38.Future work will be needed to help organizations implement CSPA. In 2014, there will be a HLG project which focusses on CSPA implementation.
Annex 1
Statistical Service Definition
Example
Name | Auto coding |
Level | Definition |
GSBPM | 5.2 Classify & Code |
Business Function | This Statistical Service maps a field to classification code |
Outcomes | This results in a transformed data set that is coherent with the target classification scheme |
Restrictions | None |
GSIM Inputs | Unit data set, unit data structure, processing activity, classifications, codelist, Rules |
GSIM Outputs | Unit data set, unit data structure, number of failed (uncoded) fields |
Service dependencies |
Statistical Service Specification
Example
Statistical Service Specification: Autocoding
Protocol for Invoking the Service
This service is invoked by calling a function called "CodeDataset". There are the following seven parameters (all of them are expressed as URI's, i.e. all data is passed by reference)
1) Location of the codelist;
2) Location of the input dataset;
3) Location of the structure file describing the input dataset
4) Location of the mapping file describing which variables in the input dataset to be used
5) Location of the output dataset generated by the service
6) Location of the structure file describing the output dataset generated by the service
7) Location of the process metrics file generated by the service.
All parameters are required.
The protocol used to invoke this function is SOAP, and is in compliance with the guidance provided for developing Statistical Service by CSPA.
Input Messages
The first four parameters for the service refer to input files.In GSIM terms, the inputs to this service are:
1) a NodeSet consisting of Nodes, which bring together CategoryItems, CodeItems, and other Designations (synonyms).
2) a Unit data set – the texts to be coded for a particular variable
3) a Data structure, describing the structure of the Unit data set
4) a set of Rules, describing which variables the service should use for which purpose.
1) The codelist to be passed in must be expressed as a DDI 3.1 instance, using the following structure. The table below shows the mapping of the conceptual GSIM objects to their encoding in DDI 3.1:
DDI 3.1 Element | GSIM Object |
DDIInstance (@id, @agency, @version) | Processing Activity |
ResourcePackage (@id, @agency, @version) | [No conceptual object] |
Purpose (@id) | [No conceptual object] |
Logical Product (@id, @agency, @version) | [No conceptual object] |
CategoryScheme (@id, @agency, @version) | CategorySet |
Category (@id, @version) | CategoryItem |
CategoryName | CategoryItem/Name |
Label | Designation |
CodeScheme (@id, @agency, @version) | CodeSet |
Code | CodeItem |
CategoryReference | [Correspondence with CategoryItem in GSIM] |
Scheme | [Implementation Specific] |
IdentifyingAgency | [Implementation Specific] |
ID | [Implementation Specific] |
Version | [Implementation Specific] |
Value | CodeValue |
For the sake of simplicity, it is assumed that the file contains only one CategoryScheme, that all Codes refer to Categories in the CategoryScheme, and that there is only one CodeScheme.
2) The unit data set is a fixed-width ASCII file containing at least a case ID (50 characters maximum) and a variable containing text strings to be coded. Each entry should be on a single line. The corresponding GSIM objects:
Data File | GSIM Object |
Unit data set | Unit Data Set |
Case ID | Unit Identifier Component |
Text string | Attribute Component |
3) The structure of the unit data set must be expressed as a DDI 3.1 instance, using the following structure. The table below shows the mapping of the conceptual GSIM objects to their encoding in DDI 3.1:
DDI 3.1 Element | GSIM Object |
DDIInstance (@ id, @ agency, @version) | Processing Activity |
ResourcePackage (@id, @agency, @version) | [No conceptual object] |
Purpose (@ id) | [No conceptual object] |
Logical Product (@id, @agency, @version) | [No conceptual object] |
DataRelationship (@id, @version) | Record Relationship |
LogicalRecord (@allvariablesInLogicalRecord="true") | Logical Record |
VariableScheme (@id, @agency, @version) | [No conceptual object] |
Variable (@id, @version) | Represented Variable/Instance Variable |
VariableName | Name |
Representation | Value domain |
TextRepresentation (@ maxLength) | [No conceptual object] |
Note: For the PoC we will simply assume that variables appear in the data set as they are ordered in the DDI file. Furthermore, only one VariableScheme is assumed.
4) The mapping of the variables that are used by the service, to the roles they have within the coding process, must be expressed in the XML format described below. In GSIM terms, these mappings can be seen as Rules.
XML Element | Description |
DatasetMap | Container for mappings |
Mapping | Mapping of variable to a role |
Role | Role of a variable within the service. Can have the content DataId or DataToCode |
VariableReference | Refers to the variable from input 3 (unit dataset structure) playing the given role |
ID | ID of the variable |
IdentifyingAgency | Agency identifying the variable |
Version | Version of the variable |
Output Messages
The output of the service contains of three files. In GSIM terms, the outputs of this service are:
5) a Unit data set containing the coded data for the variable concerned;
6) a Data structure, describing the structure of this Unit data set
7) a Process Metric, containing information about the execution of the service.
These generated files will be placed at the locations indicated by the 5th, 6th and 7th input parameters. No return parameter will be generated by the service.
5) The unit data set will be a fixed-width ASCII file containing (for the successfully coded entries) the case ID (50 characters maximum) followed by the Code. Each entry should be on a single line.
Data File | GSIM Object |
Unit data set | Unit Data Structure |
Case ID | Unit Identifier Component |
Code | CodeValue |
6) The structure of the unit data set will be expressed as a DDI 3.1 instance, using the following structure. The table below shows the mapping of the conceptual GSIM objects to their encoding in DDI 3.1:
DDI 3.1 Element | GSIM Object | |
DDIInstance (@ id, @ agency, @version) | Processing Activity | |
ResourcePackage (@id, @agency, @version) | [No conceptual object] | |
Purpose (@ id) | [No conceptual object] | |
Logical Product (@id, @agency, @version) | [No conceptual object] | |
DataRelationship (@id, @version) | Record Relationship | |
LogicalRecord (@allvariablesInLogicalRecord="true") | Logical Record | |
VariableScheme (@id, @agency, @version) | [No conceptual object] | |
Variable (@id, @version) | Represented Variable/Instance Variable | |
VariableName | Name | |
Representation | Value domain | |
TextRepresentation (@ maxLength) | [No conceptual object] |
Again, for the PoC it is simply assumed that variables appear in the data set as they are ordered in the DDI file.
7) The Process metrics will be expressed as an XML file structured in the following way:
XML Element | Description |
CodingMetrics | Container for the coding metrics |
Result (@Datetime) | Contains the results of the service execution started at the given date/time |
TotalRows | The number of rows found in the input dataset |
TotalCoded | The number of successfully coded records |
Error Messages
When the coding process cannot be executed or is aborted due to some error, the service will return an error message. The following error messages can be generated by the service.
Error message | Description |
Error in input codelist | The input codelist cannot be read, is syntactically invalid or its content is inconsistent |
Error in input dataset | Either, the input dataset, the structure file describing the dataset or the input mapping file cannot be read or contains some error. |
Other/unspecified error | Some error occurred during the coding process |
The error message will be returned to the caller in the form of a SOAP Exception. Note that this SOAP Exception may contain an InnerException providing more detailed information about the error.
- http://www1.unece.org/stat/platform/display/CSPA/Common+Statistical+Production+Architecture+Home ↩ ↩