

4.0 Results for the overall index, AAI
4.0.1 Ranking of countries for the overall index
Two Nordic countries, namely Sweden and Denmark, as well as Ireland, the United Kingdom and the Netherlands come at the top of the ranking across EU Member States (see Figure 4.1). In contrast, the majority of the Central and Eastern European countries, as well as Greece, are at the bottom of the ranking and have a clear scope for further improvements. Cyprus is the only Southern European country to be among the top ranked EU countries, positioning itself alongside Finland and Luxembourg. The Czech Republic performs exceptionally well in comparison to other EU Member States from Central and Eastern Europe.
Figure 4.1: Ranking of countries by the overall AAI (all domains together) for* the total population and for differences between men and women
The numerical value of the AAI shows that even the top performing countries must aim for further improvements. For example, even Sweden which is a front runner, has a significant untapped potential as it falls short by more than half (56%) from the most desired status possible. The countries on the other end of the spectrum (Poland, Slovakia and Hungary) have a larger gap (in excess of 70%) and thus they require greater policy efforts as they have a clearly higher untapped potential with respect to active and healthy ageing.
In almost all countries, women fare worse than men, particularly so in the three Southern European countries (Cyprus, Malta and Greece) but also surprisingly in the Netherlands and Luxembourg. The opposite is true only for the two of the Baltic States (Latvia and Estonia) and also there are only marginal gender differences in the neighbouring Finland and Lithuania.
A positive correlation with per capita GDP shows that the countries with relatively higher standards-of-living are generally more successful in experiences of active ageing and in generating better capacity and enabling environment for active and healthy ageing among older people (see Figure 4.2). Note here that the correlation does not imply causality, and in this case the causality could run in either direction: higher GDP lead to generating more opportunities for active ageing or the active ageing phenomenon linked with (say) untapping of the employment potential of older workers lead to economic prosperity. Also, there is no one-to-one relationship, as some countries with the same national wealth do better in terms of active ageing outcomes. For example, Cyprus does remarkably better in active ageing in comparison to many other Western and Southern European countries (e.g. Greece and Belgium), despite having a lower or similar GDP per capita.
Figure 4.2: AAI ranking in relation to the aggregate measure of GDP per capita (a proxy of average standard of living)
- r stands for the Pearsons correlation coefficient between GDP per capita and the overall AAI. Luxembourg has been left out from this scatterplot as it is clearly an outlier in terms of GDP per capita. The line is drawn using the method of LTS - Least Trimmed Squares – which is a common robust method to determine regression. Unlike the standard least squares method, which minimises the sum of squared residuals over n points, the LTS method attempts to minimise the sum of squared residuals over a subset, k, of those points, so as to be not being unduly affected by the presence of outliers.
4.0.2 Contribution of the domains to the overall index, AAI
It is also important to see the contribution of each domain to the overall AAI in the diverse group of EU countries (results are presented in Figure 4.3). - For example, the relative contribution of the domain capacity and enabling environment to the AAI is the highest in the case of Luxembourg, Belgium and France (in the Western Europe); Bulgaria and Poland (in Central and Eastern Europe) as well as in Malta and Spain (in the Southern Europe).
- The countries with the highest relative contribution in the independent, healthy and secure living domain are Hungary, Poland, Slovenia and Slovakia while Sweden, Cyprus and Ireland record the lowest contribution for this domain to the overall index.
- With regard to participation in society, the domain contribution to the overall index is largest in Italy and France as well as in Luxembourg, Ireland and Austria while Estonia, Portugal and Romania record the lowest contribution from this domain.
- Cyprus and Portugal, and also Estonia, Romania and Latvia stand out among the countries with the highest relative contribution from the employment domain, while France, Italy and Spain as well as Luxembourg and Belgium are well behind in their contribution from the same domain.
Figure 4.3: Contribution of domains to the overall* index, AAI (men & women together)
Although these results report on the relative contribution of four domains to the AAI, they do not imply that the countries with the lowest relative contribution from a domain are also the ones performing the worst within that domain. The ranking of countries within each of the four domains are shown in Table 4.1 below. For example, Portugal and Estonia perform relatively worse in the participation-in-society domain and they are indeed the ones with the lowest contribution of this domain to their overall AAI value. However, they are not the countries performing the worst in the participation-in-society domain: Poland, Bulgaria and Romania are the low ranked countries in this respect. Sweden ranks first in the overall AAI, but only leads in two of the domain-specific indices, employment and capacity and enabling environment for active ageing. Ireland fares at the top in the participation in society domain, and Denmark does best in the independent, healthy and secure living.
Table 4.1: Ranking of EU Member States, on the basis of the overall AAI and the domain specific indices (men & women together)
4.1.1 Ranking of countries for the 1st domain
The top-performing countries stand out as Sweden, Cyprus, the United Kingdom and Portugal followed by Estonia and Denmark not far behind (see the left hand side panel of Figure 4.4). In contrast, Hungary, Malta, Poland and Belgium are the countries with the highest potential for further improvements in the employment of older workers. Five other countries showing a similar extent of room for improvements with index values around 20% include Slovakia, Italy, France, Luxembourg and Slovenia. While Ireland is one of the top three ranked countries in the overall index, its performance in the employment domain falls behind ten other countries.
Figure 4.4: Ranking of EU countries using the 1st* domain Index, for the total population and for differences between men and women
Gender differences in the employment domain are illustrated on the right hand side panel of Figure 4.4. It is obvious that women score worse than men in all countries (except Estonia and Latvia). While the difference is hardly observable in the case of Latvia and Estonia (only 2% and 3% points respectively) and also stays low in Finland, Lithuania, France and Hungary (below or close to 5% points), it reaches as high as 20% points in Cyprus and Malta indicating that there is a great untapped potential for women's engagement in the labour market in these two countries. Gender disparity in employment is also relatively high in the Netherlands, Italy and Ireland. Such large gender gaps point to significant potential for improvement in these countries; indeed, if active ageing is possible for men in a given country, it should also be possible for women in the same country.
4.1.2 Contribution of individual indicators to the 1st domain
Figure 4.5 shows the relative contribution of four individual indicators to the employment domain for each country. The higher or lower contribution of a particular indicator does not necessarily reflect higher or lower performance on the indicator. It signals the degree to which a given indicator determines the domain index values for the countries, and ultimately their rankings in the domain, depending on the relative performance of the country on the given indicator. It is in fact equivalent to the implicit weight assigned to the indicators in each country.
Figure 4.5: Contribution of indicators to the 1st* domain (men & women together)
The relative contribution of the four indicators to the domain index is almost the same in Denmark and Lithuania, but due to its better performance in all four indicators Denmark is ranked higher in the domain (6th as opposed to the 13th position of Lithuania).
In Poland, it is the employment rate of those aged 55-59, and to a lesser extent of those aged 60-64, that affects particularly adversely the country's ranking in the employment domain. The top position of Sweden, on the other hand, is largely an outcome of high performance of this country with respect to employment of workers in the age group 60-64.
The contribution of the employment rate for the two other age groups (65-69 and 70-79) to the domain remains very low compared to that of the other two younger age groups in general. Romania and Portugal are the two notable exceptions in this regard. In their case, the relatively high ranking is due to the fact that both do remarkably well in terms of the employment rate of so-called 'silver' workers (aged 65-59 and 70-74).
Sweden, and also Germany, offer good examples of higher outcome in terms of employment rate for the 60-64 age group, and this reflects the better work incentives in pension systems in these two countries towards extending working life. On the other hand, Romania and Portugal and also Cyprus, show higher contribution from employment activity beyond the age of 65 (in the age group 65-69 and 70-74). The higher employment activity beyond retirement age in these countries may partly reflect better work environment for an ageing workforce and partly be due to constraints of low pension income outcomes.
4.1.3 Relationship between employment and capacity-and-enabling-environment-for-active-ageing domains
In evaluating active ageing outcomes in specific domains, it is important to also account for differentials in the capacity and enabling environment for active ageing across these countries. For example, it is only fair to compare active ageing outcomes between Sweden and Romania by factoring in differences in terms of the capacity and enabling environment.
Figure 4.6: Relating employment domain index with the capacity-and-enabling-environment-for-active-ageing index
The scatterplot in Figure 4.6 shows how employment index links with the index of the capacity and enabling environment for active ageing. The results show that the correlation between these two indices is not strong (r=0.33), implying that the employment outcomes for older populations are driven by factors other than those included here in measuring the capacity and enabling environment for active ageing (such as healthy life expectancy, mental well-being, social connections, etc.).
For example, the differences across BENELUX countries show that despite the same score on the capacity and enabling environment for active ageing index for the three countries, Luxembourg and Belgium have much lower employment outcomes for older workers than those observed for the Netherlands. This raises the all-important question what insights Belgium and Luxembourg can draw from the labour market and pension policies of the Netherlands.
4.2 Results for the 2nddomain: Participation in society
The second domain used for measuring active ageing index contains four individual indicators:
- Voluntary activities: Percentage of older population aged 55+ providing unpaid voluntary work through the organisations.
- Care to children, grandchildren: Percentage of older population aged 55+ providing care to their children/grandchildren (at least once a week).
- Care to older adults: Percentage of older population aged 55+ providing care to elderly or disabled relatives (at least once a week).
- Political participation: Percentage of older population aged 55+ taking part in the activities of meeting of a trade union, a political party or political action group.
Figure 4.7: Ranking of EU countries using the 2nd domain Index, for the total population and for differences between men and women
4.2.1 Ranking of countries for the 2nd domain
When looking at the index for the participation in society domain, the three top-performing countries are Ireland, Italy and Luxembourg (Figure 4.7). In contrast, Poland, Romania and Bulgaria stand at the bottom of the country ranking within this domain, with an overall index score almost half of that of the best performing countries within EU27. Hungary performs better in this domain in comparison to its position in the overall AAI. In contrast, Denmark fares relatively worse in this domain (the 10th position among the 27 EU Member States) than in the overall AAI (the 2nd position).
With respect to gender differences, women tend relatively more often to score better than men in this domain. The gender difference is particularly notable in Latvia and Greece, where women does better than men. The opposite is true in Luxembourg.
4.2.2 Contribution of individual indicators to the 2nd domain
As Figure 4.8 shows, out of the four indicators that constitute the participation-in-society domain, it is generally the indicator on care to children/grandchildren whose relative contribution to the domain is the most pronounced. In ten of the 27 EU countries, this indicator is responsible for more than 50% of the overall domain results. Therefore, this indicator has a large implicit weight and thus a high impact on the ranking of countries.
Figure 4.8: Contribution of indicators to the 2nd* domain (men & women together)
- The low ranking of Poland is, for instance, mainly due to the low percentage in volunteering activities through organisations, but it also scores low in the indicator with respect to care provision to children, grandchildren.
- The high ranking of Sweden in this domain mostly reflects the high share of its population engaged in volunteering and political activities. Its loss of top position is primarily due to a lower share of the population engaged in personal care for elderly (10% in comparison to EU average 13%) and the care provision to children, grandchildren (26% in comparison to EU average 32%). However, there are some conceptual caveats which should be kept in mind in the interpretation of the indicators on care provision since the state provisions in Sweden for these two purposes are much higher than in many other EU countries.
4.2.3 Relationship between participation-in-society and capacity-and-enabling-environment-for-active-ageing domains
Figure 4.9 plots the relationship between the indices for the participation in society domain and the capacity and enabling environment for active ageing domain. There is high correlation between these two indices (r=0.79) which show that the active ageing capacity as captured by indicators of the 4th domain (such as healthy life expectancy, mental well-being, social connections, etc.) are strong associates of social participation outcomes for older populations across EU countries. Notable results are observed for Ireland and Italy, whose social participation index score is higher in comparison to other countries of comparable active ageing capabilities.
Figure 4.9: Relating participation-in-society* and the capacity-and-enabling-environment-for-active-ageing indices
4.3 Results for the 3rd domain: Independent, healthy and secure living
The third domain is the largest of the four domains used for measuring the active ageing index. It contains the following eight individual indicators of active and healthy ageing:
- Physical exercise: percentage of older population aged 55+ who engage in physical activity and sport at least five times a week.
- Access to health and dental care: percentage of older population aged 55+ who report no unmet need for medical and dental examination.
- Independent living arrangements: percentage of persons aged 75 and older living in single or couple households.
- Relative median income: ratio of the median equivalised disposable income of people aged 65+ to the median equivalised disposable income of those aged below 65.
- No poverty risk for older persons: percentage of people aged 65+ who are not at the risk of poverty using 50% of the national median equivalised disposable income as the poverty threshold.
- No severe material deprivation for older persons: percentage of people aged 65+ not severely materially deprived.
- Physical safety for older population: percentage of older population aged 55+ who are not worried about becoming a victim of violent crime.
- Lifelong learning: percentage of older persons aged 55-74 who received education or training in the 4 weeks preceding the survey.
4.3.1 Ranking of countries for the 3rd domain
Denmark, Sweden and the Netherlands are the top ranking countries in the independent, healthy and secure living domain (Figure 4.10). On the other extreme, Latvia, Bulgaria and Greece are ranked at the bottom indicating that older people have a much harder time to live an independent, healthy and secure life in these countries. Interestingly, Hungary and Poland, which are among the three bottom ranked countries in the overall active ageing index perform relatively well in this domain.
Figure 4.10 also shows that with the exception of Denmark, the Netherlands and Malta, where women have similar conditions for independent, healthy and secure living compared to men, women in the majority of countries score worse than men. This is especially the case in some of the Central and Eastern European EU Member States, such as Romania, Bulgaria, Latvia, Hungary and Slovakia, but also in Greece. Differences between men and women however remain relatively small across countries (below 5% points, with the exception of Bulgaria).
Figure 4.10: Ranking of EU countries using the 3rd* domain Index, for the total population and for differences between men and women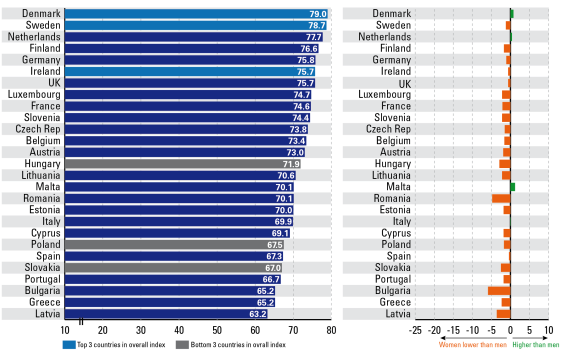
4.3.2 Contribution of individual indicators to the 3rd domain
The top position of Denmark, Sweden and the Netherlands in the 3rd domain reflect their high performance at the single indicators level. In particular, Denmark excels in physical safety and lifelong learning indicators. Less than 8% of the Danish older population report problems regarding physical safety as opposed to more than 40% in Greece and Slovakia. It is therefore not surprising that the relative contribution of the physical safety indicator to the domain is high in Denmark; other countries with higher contribution for this indicator are Poland and Latvia (see Figure 4.11).
The share of those participating in lifelong learning is below 1% in Greece and Slovakia together with Hungary and Poland while in Denmark it reached 22%. Denmark has the highest relative contribution from the lifelong learning indicator.
While a relatively high share of the older population (over 95%) tends to have no unmet needs of health and dental care in Slovenia, the Netherlands, Belgium, Denmark, Ireland, Luxembourg and the United Kingdom, the corresponding figure is only 77% in Latvia and Romania highlighting the extent of room for improvement in the lowest performing countries. Malta, Bulgaria and Lithuania stand out for their relative contribution of the unmet needs indicator to the domain index (Figure 4.11).
Country performance in the area of financial security for older people varies depending on the particular indicator. In terms of relative poverty risk, the three best performing countries are the Czech Republic, Hungary and the Netherlands. Cyprus and Bulgaria are the worst performers. The proportion of older people not affected by severe material deprivation ranges from 56% in Bulgaria though around 70% in Latvia, Lithuania and Romania to over 99% in Luxembourg, Denmark, the Netherlands and Sweden.
Figure 4.11: Contribution of indicators to the 3rd domain (men & women together)
4.3.3 Relationship between independent-healthy-and-secure living and capacity-and-enabling-environment-for-active-ageing domains
Figure 4.12 shows that the relationship between independent, healthy and secure living index and the index for the capacity and enabling environment for active ageing domain is also strong. There is high correlation between these two indices (r=0.77) which show that the active ageing capacity is strongly associated with the independent living outcomes. Notable results are that Spain, Italy and Greece and also Bulgaria and Latvia score relatively low in the independent, healthy and secure living in comparison to other countries of comparable active ageing capacities.
Figure 4.12: Relating independent-healthy-and-secure* living index with the capacity-and-enabling-environment-for-active-ageing index
4.4 Results for the 4th domain: Capacity and enabling environment for active ageing
The domain capacity and enabling environment assesses a number of indicators that can be considered as pre-requisites for active ageing or factors that facilitate or contribute to active ageing. It is similar to a measure of potential for active ageing. Among the pre-requisites for active ageing are first of all to be able to live longer (i.e. life expectancy) in a healthy condition (e.g. share of life expectancy lived in good health, mental well-being). Among the enabling factors or active ageing capital are use of ICT, social contacts and educational attainment. Thus, the following six indicators have been included in this domain:
- Remaining life expectancy achievement of 50 years at age 55
- Share of healthy life years in the remaining life expectancy at age 55
- Mental well-being
- Use of ICT by older persons aged 55-74 at least once a week (including everyday)
- Social connectedness: Percentage of older population aged 55+ who meet friends, relatives or colleagues at least once a month
- Educational attainment of older persons: Percentage of older persons aged 55-74 with upper secondary or tertiary educational attainment
Figure 4.13: Ranking of EU countries using the 4th* domain Index, for the total population and for differences between men and women
4.4.1 Ranking of countries for the 4th domain
Overall, countries which are in the top five of the aggregated AAI are also forerunners in this particular domain (see Figure 4.9). The exception is Luxembourg, which does remarkably well in terms of capacity and enabling environment for active ageing, but then seems to fall short of fulfilling its potential in the aggregated AAI. The same could also be said of Belgium and Spain, which rank considerably higher in the domain of capacity and enabling environment for active ageing (8th and 12th respectively) than in the overall AAI (14th and 17th). On the opposite direction, Cyprus and Portugal manage to age actively – aggregate AAI – despite having relatively lower capacities and enabling environment for active ageing.
Differences between women and men in the index values of this domain are relatively small (see right panel of Figure 4.8) particularly if compared to the results of the 1st domain. While the index values for women are lower than that of men in the majority of countries indicating better capacity and enabling environment for active ageing for men, there are some countries, for instance Estonia, Finland, Lithuania and Slovenia, where the opposite is the case.
4.4.2 Contribution of individual indicators to the 4th domain
A closer look at the indicators that make up this domain shows that France, Italy and Spain have the highest life expectancies at the age of 55, but a great share of this life expectancy is apparently lived in poor health, both physical and mental. This inverse relation is not always the case though. Sweden has, for instance, a high life expectancy at 55 and yet good health indicators for its older population. Members States from Central and Eastern Europe and Portugal seem to have the worst of two worlds: relatively lower life expectancy at 55 and a relatively poor health condition.
As for the relative contribution of the remaining life expectancy at 50 indicator, the Southern European countries have a relative contribution in excess of 40% (see Figure 4.14). Malta in particular score high for the remaining life expectancy and healthy life expectancy indicators, and Romania and Bulgaria score high for the contribution of the healthy life expectancy.
As for the other enabling factors – use of ICT, social contacts and educational attainment – each indicator seems to tell a different story as far as the country ranking is concerned. Overall, however, social connectedness is one of the indicators with greater scope for improvement for countries and one where there are substantial cross-country differences. Portuguese and Spanish fare very well in maintaining social contacts in old age, but this is far from being the case for Greek and Cypriot older people who are much less likely to maintain social contacts with friends or relatives. This makes them closer to the Germans and Central and Eastern European counterparts, which are in general far more socially isolated.
Figure 4.14: Contribution of indicators to the 4th* domain (men & women together)
Finally, with regard to educational attainment, Portugal, Malta, Spain, Italy or Greece do not just compare unfavourable with the EU average, but they are also relatively far behind that average (the difference ranging from 20% points for Greece to 40% points in the case of Portugal). In contrast, this is one indicator where Member States from Central and Eastern Europe and also Germany do best. The relative contribution of educational attainment is high in Latvia, Lithuania, Slovakia and Estonia (close to 10%) and remarkably low in Portugal (1.7%).